Countdown to July 4th, 2024

Major Economic Benefits from Fireworks Show
2022 Big Bay Boom
Economic Impact Estimate
San Diego State University
Center for Hospitality and Tourism Research
![]()
The Center for Hospitality Research in the L. Robert Payne School of Hospitality and Tourism Management has conducted economic impact assessment for the better part of 2 decades at the local and national level. Tourism and economic impact studies have been provided for small concerts, fairs and tournaments up through national organizations such as the NCAA College Bowl Game Association.
Mark R. Testa, Ph.D.
Dr. Testa is an award winning, internationally recognized business and hospitality management educator and researcher with over 15 years of management experience and 35 years of teaching and research experience. Dr. Testa conducts tourism and economic impact assessments regularly with some 20 projects per year. Current and past clients include the National Bowl Game Association, US Open Golf, America’s Cup, San Diego Tourism and Marketing District (SDTMD), Balboa Park, San Diego Pride, Holiday Bowl, and San Diego Food Bank. Other consulting clients include IBM, Princess Cruise Lines, Carnival Cruise Lines and the Miami Heat.
Christina Hilmer, Ph.D.
Tia Hilmer has been on faculty in the Department of Economics at San Diego State University for over 17 years and a full professor for over 11 years. She holds a joint Ph.D. in Economics and Statistics from North Carolina State University, a Master’s degree in Statistics from North Carolina State University, and a Bachelor’s degree in Mathematical Economics from University of California, Santa Barbara. She has published 25 journal articles, 13 of which are in top field or general interest journals, and in 2014 she published a co-authored McGraw Hill textbook, Practical Econometrics: Data Analysis, Analysis and Application. Along with Mark Testa and Carl Winston, she has generated economic impact reports for many popular San Diego sporting events including the Holiday and Poinsettia Bowls, U.S. Open, San Diego Rock and Roll Marathon, as well as non- sporting events such as San Diego Pride and Balboa Park.
Carl Winston
Carl Winston has 40 years of experience in a variety of senior executive level hospitality, event and tourism industry positions in academia and the “real world.” He is the founding Director of the L. Robert Payne School of Hospitality & Tourism Management at San Diego State University. He also owns Real World Academics a firm that conducts projects from economic impact studies, talent acquisition and strategy to acquisition and development for small companies and large, including Disney, Marriott, Four Seasons, American Hotel & Lodging Association and Meeting Professionals International.
He also owns Real World Academics a firm that conducts projects from economic impact studies, talent acquisition and strategy to acquisition and development for small companies and large, including Disney, Marriott, Four Seasons, American Hotel & Lodging Association and Meeting Professionals International.
Executive Summary
The following report estimates the economic impact on San Diego County of the Big Bay Boom Fireworks show which took place at 9:00 pm July 4, 2022. The report uses an attendance estimate, a survey of non-local attendees and the Regional Input-Output Modeling System (RIMS II)1 multiplier to determine total economic impact. For the purposes of this report, total economic impact is defined as the expenditure of money from sources outside the San Diego area which resulted from hosting the events. Both direct economic impact from nonlocal attendees, such as spending on lodging, shopping and entertainment, and food and beverage is used to determine the total economic impact, as well as indirect impact which includes additional business generated in the local area resulting from Big Bay Boom activities.
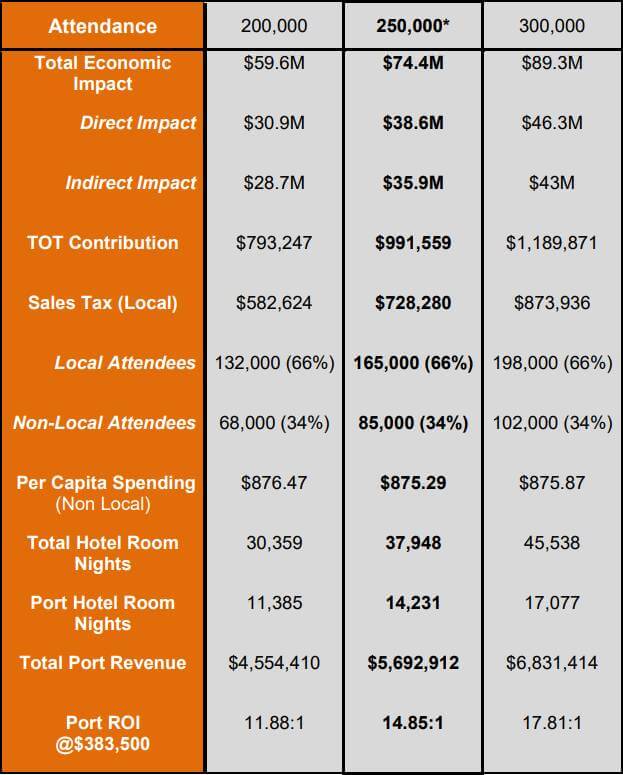
The total economic impact on San Diego County for the fireworks is largely dependent on attendance which is discussed in the methodology section. Given the lack of a scientific estimate of attendance, an informal total provided by the Harbor Police was used as a range from 200,000-300,000 individuals. For the purposes of this study, 200,000 is viewed as the low total, 300,000 as the high total and the 250,000 as the most likely total. The EI is estimated at from $59.6 million-$89.3 million depending on the attendance total achieved with $74.4 million at 250,000 attendees. The total is comprised of between $30.9 million-$46.3 million of direct impact and from $28.7 million-$43 million of indirect impact. This EI is the result of some 34% attendees reporting they are non-local.
Some 42% non-local attendees came to San Diego for the primary purpose of attending the fireworks. An estimated 64% of this non-local group stayed in a hotel during their visit with an average of 4.8 room nights at $248.85 per night. An estimated 30,359-45,538 hotel room nights were sold during the event.
In addition to the direct and indirect impacts listed above, Big Bay Boom generated tax revenue for the city of San Diego. The transient occupancy tax of 10.5% generated revenue of between $793,247-$1,189,871. The San Diego portion of sales tax on food and beverage, entertainment and shopping is estimated at between $582,624-$873,936. The title sponsor of the fireworks, the Port of San Diego contributed some $383,500 to cover a variety of costs. With tenant revenue ranging from $4,554,410-$6,31,414 the ROI ranged from 11.88:1-17.81:1. Put simply, for every dollar the Port provided in sponsorship, it yielded back between approximately $12-$18 in tenant revenue. Past study2 looked at Port Sponsorship costs in relationship to Port Rent which generated approximately 78 cents for every dollar. The totals here illustrate a much greater return in comparison with the impact of BBB on local businesses.
Big Bay Boom Summary Chart (Table 1)
Data Collection Methodology
The Survey
- An intercept-survey of spectators was conducted just before the fireworks began. The goal of the survey was to assess visitor characteristics and spending patterns for non-local attendees in particular. A 23-item survey was designed specifically for use at BBB by SDSU researchers. These surveys have been used successfully over the past 12 years for a variety of cultural and sporting events. Items on the survey included questions regarding visitor place of residence, lodging accommodations, expenditures, travel accommodations and basic demographics. If a respondent indicated their place of residence as San Diego, they were only asked demographic related questions.
- To collect responses to the survey items, face-to-face interviews were conducted with randomly-selected attendees. A team of 20 interviewers and 3 supervisors were trained extensively on the data collection process to minimize response bias. The goal of the survey was to gain as accurate a picture as possible of attendee behavior. A training session was conducted which provided detailed item discussion, interview practice and role playing, as well as a Q&A session. Particular attention was paid to ensuring valid and reliable responses. Anonymity of the responses was ensured by the interviewers and participation was completely voluntary.
- The data collectors were assigned strategic locations around the fireworks including teams at the Embarcadero, Shelter Island and Harbor Island. Data were collected immediately before the fireworks began.
The Responses
- A total of 541 interviews were conducted for Big Bay Boom. Using a 95% confidence level and 5% margin of error, the sample size estimated is 387. The total 541 surveys represents an almost 40% increase and a reasonable sample for the current study.
Attendance
- The attendance number is vital in estimating economic impact. For the 2022 event, no official or scientific assessment of attendance was conducted due to the very large and multifaceted nature of attendance, the geographic spread of this particular event. While the Harbor Police conducted and informal assessment of attendance and deemed it a “medium” sized event relative to past years, no verifiable measure was available to support the attendance total estimated. Based on this, a conservative range was used based on the Harbor Police estimate of 250,000 total individuals attending.
Big Bay Boom Analysis
Economic Impact Estimate of Big Bay Boom Fireworks
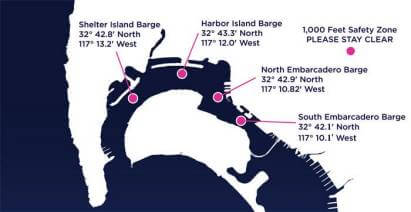
- Big Bay Boom Fireworks take place on July 4th on San Diego Bay. The show is visible from Shelter Island in the north west all the way to the South Embarcadero in the south west part of the city. Beginning at 9:00 pm, the fireworks shoot off from barges around the bay.
- The resulting economic impact of visitors to San Diego was estimated using attendance figures, a survey of non-local attendees and the RIMS II economic multiplier3 to determine total economic impact. Total economic impact is defined as the expenditure of money from sources outside the San Diego area which resulted from hosting the event. Both direct economic impact from non-local attendees, such as spending on lodging, shopping and entertainment, and food and beverage is used to determine the total economic impact, as well as indirect impact which includes additional business generation in the local area resulting from the events.
- The following tables provide an overview of Big Bay Boom’s estimated economic impact based on attendance:


- Non-local respondents spent an average of $135.00 on food and beverage during their stay with a daily median of $100.00 per day. In addition, non-locals spent an average of $78.00 on shopping and a median of $20.00 per day. Finally, the average spent on entertainment was $109.00 during their stay with a daily median of $50.00.
- Finally, many of the surveyed non-local attendees planned to attend other attractions in the San Diego area:
Other Attractions Planned to Visit
While in San Diego
(Among those staying one night or more in San Diego)

Attendance
- Of the 200,000-300,000 estimated attendees, an estimated 34% were non-local attendees.

- Some 42% of the non-local respondents reported that Big Bay Boom was their main reason for visiting San Diego.
- Attendees came from various locations:

Accommodations
Attendee Room Nights
- Of the 42% whose main reason for traveling to San Diego, some 64% stayed in a hotel during their visit with an average of 4.8 room nights at $248.85 per night. The survey indicates the average daily rate (ADR) for this event was $248.85 per night.
- Between 30,359-45,538 spectator hotel room nights were sold during the event.
Visitor Demographics & Profile
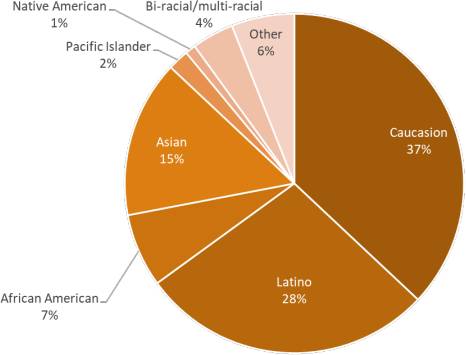
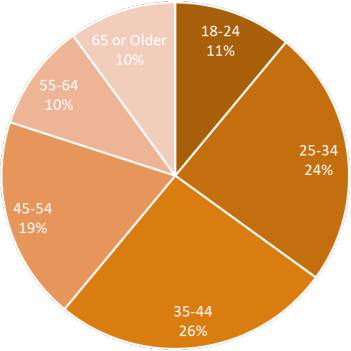
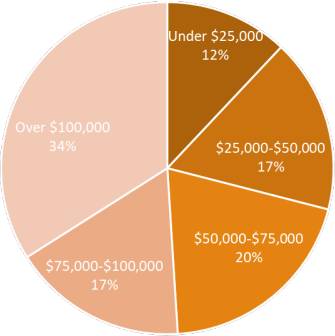
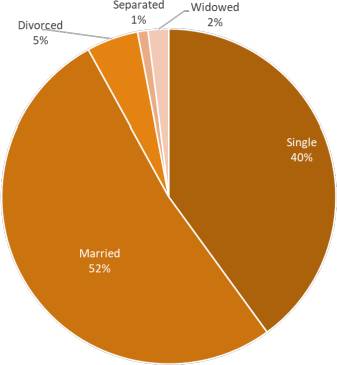
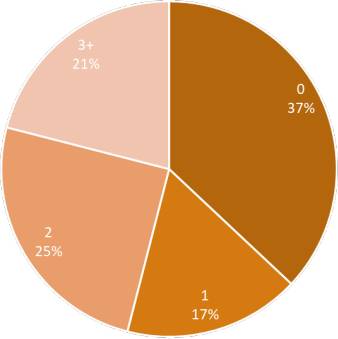
- Additional demographic information was collected during the event for both local and non-local attendees. The following charts provide an overview of each demographic question. Following the charts, a summary profile is provided.
A. How do you identify yourself?
B. Age of Respondents
C. Income
D. Marital Status
E. Number of Children
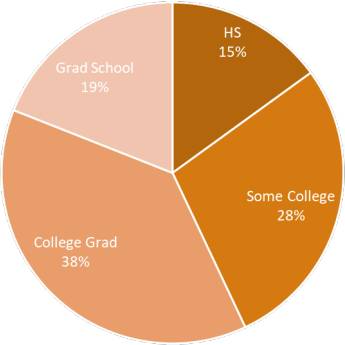
F. Education Level
Port Return on Investment (ROI)
The Port of San Diego is the title sponsor of the Big Bay Boom fireworks. As part of the impact of the event, an assessment of return on those sponsor dollars was conducted. First, Hotel impacts were calculated followed by a breakdown of estimated retail and restaurant sales and the corresponding ROI.
Hotel Stays
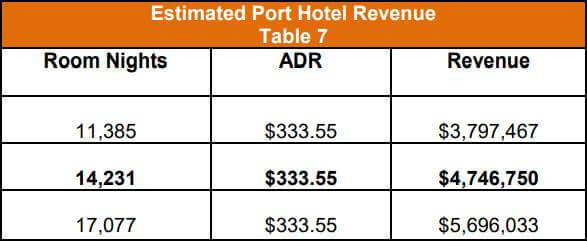
- Some 37.5% of the total hotel rooms generated as a result of the fireworks were at Port Tenant Hotels. Based on the survey data, a range of room nights were generated from 11,385 -17,077 with the midrange estimate at 14,231. Primary hotels used for the event include Hilton San Diego Bayfront, Sheraton San Diego Hotel & Marina (Marina Tower), Sheraton San Diego Hotel & Marina (Bay Tower), Hilton San Diego Airport Hotel, and Kona Kai Resort.
- While the Average Daily Rate (ADR) for all hotels booked during the fireworks was $248.85, the ADR for Port properties was significantly higher at $333.55 or 34% higher. The resulting hotel revenue is shown below in Table 7.
Port Revenue
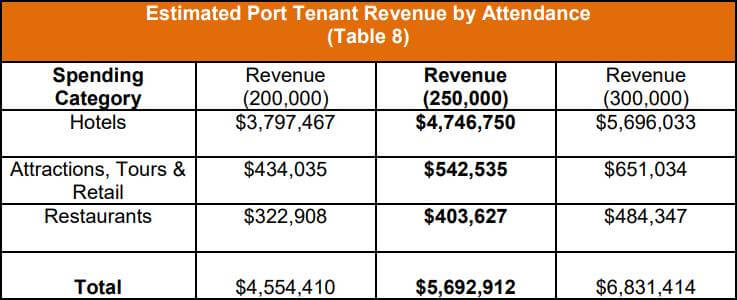
- An estimate of Port Revenue was conducted using primary survey data and secondary data from previous studies.4 Proportions of hotel, retail and restaurant funding were calculated and extrapolated using the range of attendance numbers previously discussed. Table 8 shows the range of Port revenue generated by attendance.
Port Funding
- As the title sponsor for the Big Bay Boom Fireworks some $213,5005 in sponsorship funding was provided in 2022. These funds were primarily used for production-related expenses such as pyrotechnic services, barges, tugboats, regulatory fees and technical services. In addition, some $170,000 was provided for event-related services such as park maintenance and clean up, additional security and traffic control, on-bay safety patrols and portable toilets. The Port’s total sponsorship for the 2022 Big Bay Boom totaled $383,500.
ROI
- Return on investment is the relationship between Port dollars used to support the Big Bay Boom Fireworks and the dollars generated as a result. In other words, for every dollar invested, X dollars were generated. Table 9 shows the varying ROI based on the range of attendance numbers. As an interpretation, at totals generated for 250,000 attendees, the Port of San Diego received almost $15.00 for each dollar used to sponsor the Big Bay Boom Fireworks.
- To provide context when comparing the current ROI numbers to past study, the following example shows the difference. First, the previous study looked at ROI as the relationship of Port Sponsorship of BBB to Port Rents collected during that time. In the 2018 study, it was determined that 78 cents was generated for every dollar spent by the Port. In contrast, the current study looks at total revenue generated by the businesses that make up the Port area. These tenants are the direct beneficiaries of the increase in business which in turn benefits the Port. The result is between approximately $12-$17 for every dollar spent or more than 12-17x greater.

Media
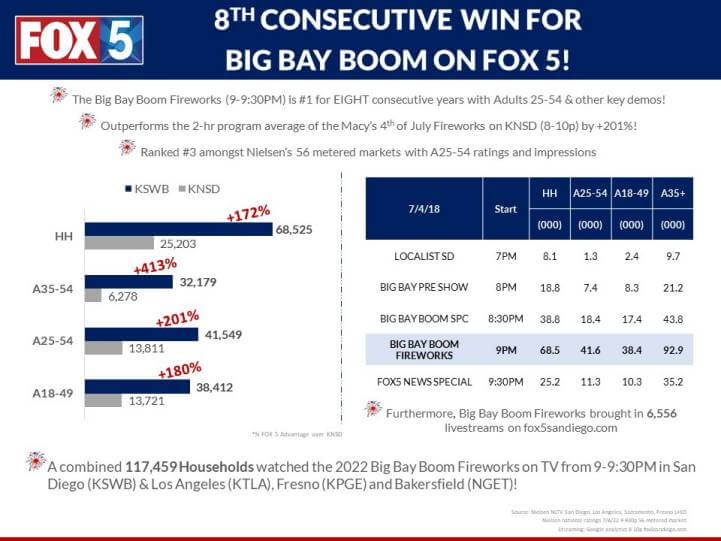
- Television and online coverage of the fireworks provides tremendous exposure for the Port of San Diego, its properties and tenants. The following graphic provided by Nielsen NLTV San Diego and Fox 5 San Diego illustrates a portion of that impact.6
References
1 https://www.bea.gov/news/blog/2020-08-03/bea-updates-regional-economic-tool
2 The Big Bay Boom: A Study of Its Economic Impact. Fermanian Business and Economic Institute at PLNU 2018, 2012.
4 The Big Bay Boom: A Study of Its Economic Impact. Fermanian Business and Economic Institute at PLNU 2018, 2012.
5 Figures provided by Port of San Diego Staff
6 Nielsen NLTV San Diego, Los Angeles, Sacramento, Fresno L+SD Nielsen national ratings 7/4/22 9-930p 56 metered market Streaming: Google analytics 8-10p fox5sandiego.com
For interest in supporting the Port of San Diego’s Big Bay Boom July 4th Fireworks Show benefiting the Armed Services YMCA, please contact H. P. “Sandy” Purdon, Executive Producer at 619-822-1177 or Send email.
 San Diego July 4th Fireworks on San Diego Bay – Big Bay Boom
